Building a Member Lifecycle Model in Snowflake
Phase 5 is the analytical centrepiece of this series. We built a Snowflake view that classifies every member into a lifecycle state — new, loyal, active, cooling, at_risk, or churned — using visit recency, frequency, and account status. The result is a segment feed that plugs directly into a CRM tool like Braze. This is the model that turns raw data into action.
Why a Lifecycle Model Exists
Every membership business has the same fundamental problem: not all members are equal, and treating them the same way wastes both marketing budget and opportunity. A member who joined last week needs a welcome email. A member who hasn’t visited in four months needs a win-back offer. A member who visits every week and has been active for two years needs a loyalty reward. Sending the same message to all three of them is noise. A lifecycle model solves this by assigning every member a state based on their behaviour — not just their account status. It’s the bridge between raw transactional data in Snowflake and targeted messaging in a CRM tool like Braze. The data engineer builds the model. The marketing team uses the segments. That handoff is exactly what a role like Tsunami Express’s data engineer position is about.What You’ll Learn in This Post How to design lifecycle states that map to CRM actions. How to build a two-CTE Snowflake view that computes visit metrics and classifies members. Why CREATE OR REPLACE VIEW lands in CARWASH_ANALYTICS.MARTS rather than CARWASH_RAW. How DATEDIFF and CASE WHEN combine to create behavioural segments. How to validate a model with a null sanity check — and what it means when NULL_COUNT = 0. Why only 2 of 6 lifecycle states appeared in the results — and what that tells us about the data.
Designing the Six Lifecycle States
Before writing any SQL, the states need to be defined in business terms. The classification logic has to be unambiguous: every member must fall into exactly one state, and each state must map to a specific CRM action. If a state doesn’t trigger a different action than another state, it doesn’t need to exist.| State | Trigger Condition | Business Action | CRM Priority |
|---|---|---|---|
| new | Enrolled ≤ 30 days ago | Welcome series, onboarding tips | High — first impressions matter |
| loyal | ACTIVE + ≥ 10 visits + visited ≤ 30 days ago | Loyalty rewards, referral incentives | Medium — retain and grow |
| active | ACTIVE + visited ≤ 60 days ago (general) | Regular engagement, upsell prompts | Medium — standard nurture |
| cooling | ACTIVE + last visit 61–90 days ago | Re-engagement campaign, check-in email | High — catch before churn |
| at_risk | ACTIVE/PAUSED + last visit > 90 days ago | Win-back offer, discount or free wash | Critical — churn prevention |
| churned | Status = CANCELLED | Reactivation campaign (long-term) | Low — accept loss, try later |
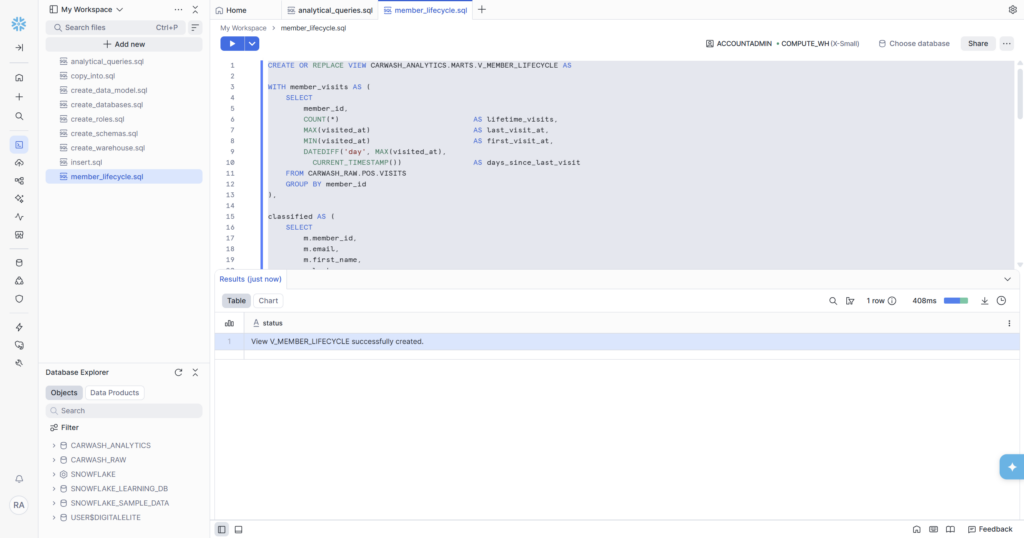
Building V_MEMBER_LIFECYCLE
The view lives in CARWASH_ANALYTICS.MARTS — not CARWASH_RAW. This is deliberate and important. CARWASH_RAW is the landing zone for source data: it reflects the world as the source systems recorded it, untransformed. CARWASH_ANALYTICS is where business logic lives. The MARTS schema specifically is for models that are ready to be consumed by dashboards, CRM tools, and analysts. Keeping them separate means you can always trace a result back to its raw source without the two layers contaminating each other.CTE 1 — member_visits: Computing Visit Metrics per Member
The first CTE does one job: for every member who has ever visited, compute four visit metrics. These become the inputs to the classification logic.
- lifetime_visits — total number of times this member has washed their car. The loyalty threshold (≥ 10 visits) uses this.
- last_visit_at — the most recent visit timestamp. MAX() gives us the latest one.
- first_visit_at — the earliest visit. Useful for tenure calculations in future models.
- days_since_last_visit — the most important metric. DATEDIFF(‘day’, MAX(visited_at), CURRENT_TIMESTAMP()) calculates how many days have elapsed since the member’s most recent visit. Every recency-based classification — cooling (61–90 days), at_risk (> 90 days) — is derived from this single number.
💡💡 Why DATEDIFF Uses MAX(visited_at) Not visited_at
The CTE groups by member_id, so there’s one row per member in the output. But a single member can have many rows in the VISITS table — one per visit. DATEDIFF needs a single timestamp to subtract from, not a list. MAX(visited_at) picks the most recent visit, which is the correct input for recency calculations. Using visited_at directly without aggregation would cause a SQL error because you can’t mix non-aggregated and aggregated columns in a GROUP BY query.
CTE 2 — classified: Joining Members to Visit Metrics and Applying CASE WHEN
LEFT JOIN rather than INNER JOIN is intentional. Some members may have enrolled but never visited — perhaps they signed up online and haven’t used their membership yet. An INNER JOIN would silently drop those members from the model. A LEFT JOIN keeps them, with NULL visit metrics, and the ELSE ‘at_risk’ branch catches them correctly — a member who has never visited is absolutely at risk of churning.
The Results — and What They Actually Tell Us
With the view created, two validation queries run against it: a distribution check across all lifecycle states, and a null sanity check.
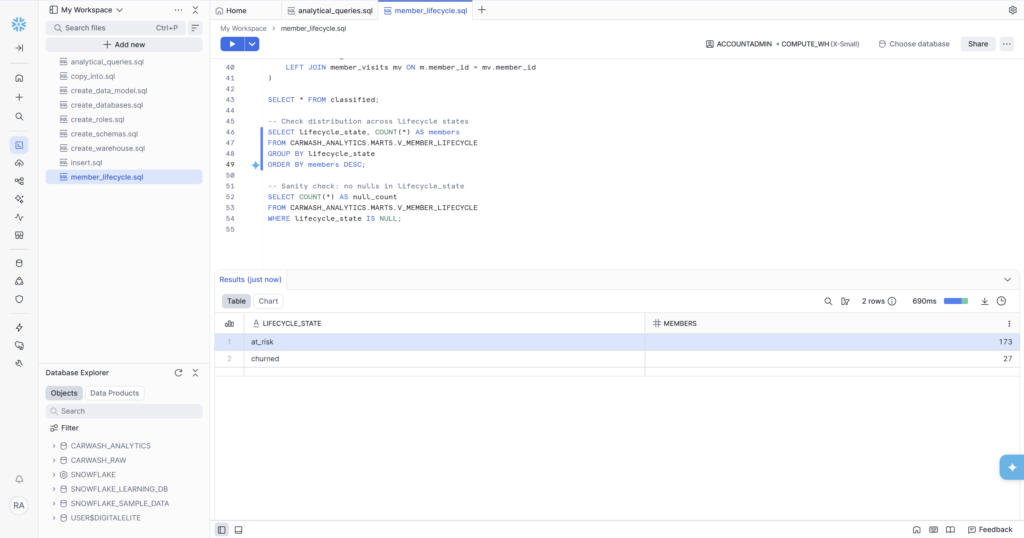
Distribution Check
| LIFECYCLE_STATE | MEMBERS | % of Total | Interpretation |
|---|---|---|---|
| at_risk | 173 | 86.5% | ACTIVE/PAUSED members whose last visit > 90 days ago |
| churned | 27 | 13.5% | CANCELLED members — matches Phase 4 cancelled count exactly |
Why Only Two States Appeared
The distribution shows only at_risk and churned — none of the other four states. This is a direct consequence of the dataset design, and it’s actually the correct and expected result for this sample data. Here’s why:
- new: Members enrolled ≤ 30 days ago. Our CSV data spans January 2021 through June 2025 — all enrollment dates are in the past relative to today (March 2026), so no member qualifies as ‘new’.
- loyal, active, cooling: All require days_since_last_visit of ≤ 90 days. The latest visits in our dataset are from September 2025 — roughly 6 months before today. Every member’s last visit is therefore more than 90 days ago, pushing them all into at_risk.
- churned: The 27 CANCELLED members from Phase 4 appear here exactly — the numbers match perfectly, which is a strong signal the model is correct.
🎯🎯 This Is a Feature, Not a Bug
The fact that all active members are classified as at_risk because our sample data is from 2021–2025 is a perfect illustration of how time-sensitive lifecycle models are. In a live production system connected to real Salesforce + POS data, members who visited last week would appear as ‘active’ or ‘loyal’. The model logic is correct — it’s the sample data’s age that determines the output.
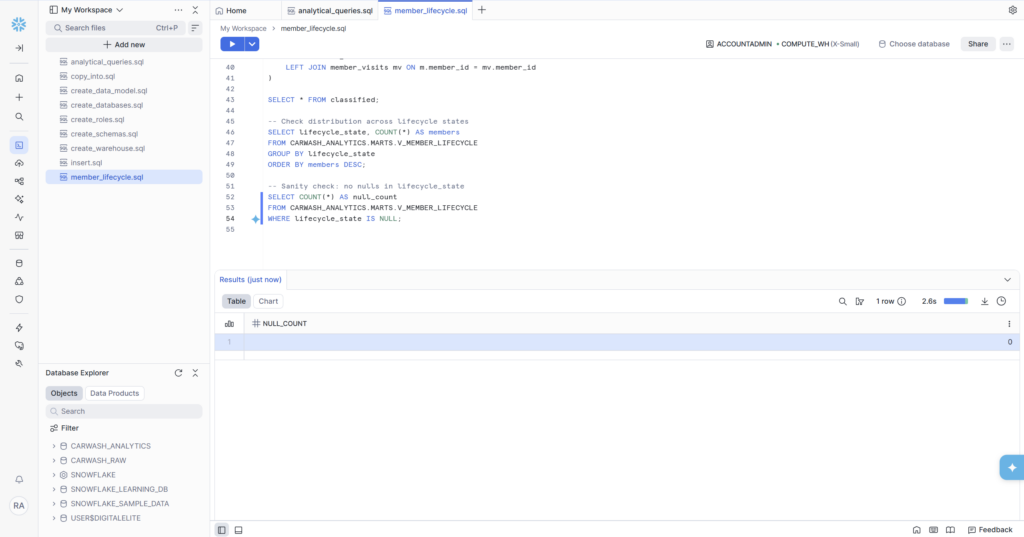
Null Sanity Check — NULL_COUNT = 0
Result: 0. This is the most important validation in the entire phase. A NULL lifecycle_state would mean a member slipped through every CASE WHEN branch without being classified — a silent data quality failure that downstream CRM tools would propagate into untagged segments and missed campaigns. NULL_COUNT = 0 confirms the ELSE ‘at_risk’ catch-all is working correctly and every single one of the 200 members has a defined lifecycle state.
Why a View and Not a Table?
This is one of the most common questions when building models in Snowflake. The answer comes down to what you need the data to do.| VIEW | TABLE | |
|---|---|---|
| Stores data physically | No — runs query at runtime | Yes — data written to disk |
| Always up to date | Yes — reflects current raw data | No — needs refresh/reload |
| Query speed | Slower (recomputes each time) | Faster (pre-computed) |
| Storage cost | None | Uses Snowflake credits |
| Best for | Lifecycle models, daily metrics | Historical snapshots, large joins |
| Used in this phase | ✓ V_MEMBER_LIFECYCLE |
V_MEMBER_LIFECYCLE is a view because the lifecycle state of a member changes every day. A member who was ‘cooling’ last week might be ‘at_risk’ this week. A member who was ‘new’ last month is now ‘active’. If this were a table, it would need to be refreshed on a schedule to stay accurate. As a view, every time Braze or a dashboard queries it, the result reflects the current state of the raw data automatically — no pipeline required.
In a more mature architecture, this view would typically become a dbt model, which adds documentation, testing, and lineage tracking on top of the same SQL logic. That’s the Phase 6 direction — wrapping what we’ve built into a proper dbt project.
How This Feeds Into Braze
The lifecycle model isn’t just an analytical exercise — it’s the input to CRM automation. In a production setup, the flow looks like this:
- V_MEMBER_LIFECYCLE runs in Snowflake and classifies all 200 members
- A scheduled export or Braze’s Snowflake integration queries the view
- Braze ingests the lifecycle_state field as a custom attribute on each member profile
- Marketing campaigns are triggered by segment: ‘at_risk’ → win-back email with discount code; ‘churned’ → reactivation sequence starting 30 days post-cancellation; ‘loyal’ → referral program invite
- Campaign performance feeds back into the data model — did the win-back email reduce days_since_last_visit?
The data engineer’s job is steps 1 and 2. Steps 3–5 are the marketing team. But the quality of steps 3–5 is completely determined by the quality of steps 1 and 2. A badly designed lifecycle model sends win-back emails to loyal members and ignores at-risk ones. The SQL in this phase is what makes the difference.
Phase 5 Complete
✅ Phase 5 Deliverables — All Complete
- V_MEMBER_LIFECYCLE view created in CARWASH_ANALYTICS.MARTS
- Two-CTE architecture: member_visits (visit metrics) + classified (CASE WHEN classification)
- Six lifecycle states defined: new, loyal, active, cooling, at_risk, churned
- 173 members classified as at_risk — correct given sample data age (all last visits > 90 days ago)
- 27 members classified as churned — matches CANCELLED count from Phase 4 exactly
- NULL_COUNT = 0 — every member has a lifecycle state, no classification gaps
- LEFT JOIN used to preserve members who have never visited
- Model lives in CARWASH_ANALYTICS.MARTS — separated from raw source data
What’s Coming in Phase 6
Phase 6 is the final phase: KPI views and Snowsight dashboards. We’ll create two summary views in CARWASH_ANALYTICS.REPORTING — one for daily KPIs (active members, daily revenue, visit counts) and one for the executive summary (MRR, churn rate, average visits per member). Then we’ll build a Snowsight dashboard that visualises everything from Phase 4 and Phase 5 in one place — the deliverable you’d actually hand to a client or a hiring manager.